Nonprofit Economic Impact Study
Nonprofits are essential to the fabric of our community, now more than ever. Quantifying their impact is a critical step to support nonprofits as part of the long-term strategic growth of our region. Explore the significant economic impact that nonprofits have on the 13-county Nashville Metropolitan Statistical Area in the latest Nonprofit Economic Impact Study, a joint research venture of the Center for Nonprofit Management and the Nashville Area Chamber of Commerce.
Executive Summary
Key takeaways and high-level findings from the Nonprofit Economic Impact Study
Interactive Report Findings
Interactive data from the Nonprofit Economic Impact Study is displayed below. For optimal viewing, please view on a laptop or desktop.
To explore the data, select the “Full Screen” button in bottom right of the Tableau window below to enlarge to full screen. After viewing, hit the “Esc” button to return back to the website view.
To view graphs for a specific nonprofit service area, please select the primary service area using the drop-down box at the top of the Tableau window.
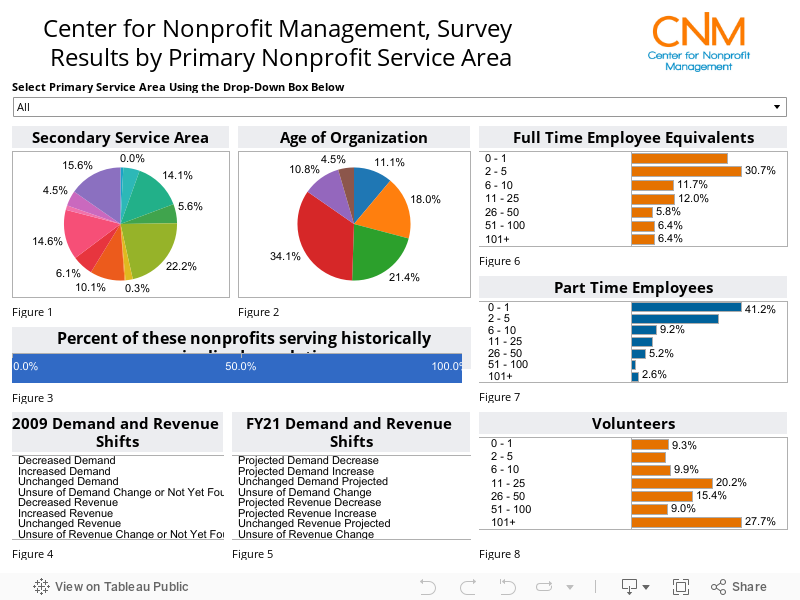
| Figure Title | Description |
|---|---|
| Figure 1: Secondary Service Area | Each nonprofit respondent could indicate a primary and secondary service area. This figure depicts the percentage of secondary service areas indicated. Hover your cursor over a pie graph wedge to see the specific area. |
| Figure 2: Age of Organization | Shows percentages of how long the nonprofit has been established. Hover your cursor over a pie graph wedge to see the specific age ranges. |
| Figure 3: Percent of these nonprofits serving historically marginalized populations | Shows the percentage of nonprofit respondents that serve historically marginalized populations including, but not limited to: people experiencing homelessness, uninsured individuals, children & youth, older adults, Black, Indigenous, and People of Color, and Immigrants, New Americans, and Refugees. |
| Figure 4: 2009 Demand and Revenue | Shows the nonprofits’ demand for services and revenue changes based on 2009 data during the Great Recession. |
| Figure 5: FY21 Demand and Revenue Shifts | Shows the nonprofits’ expected demand for services and revenue changes for the 2021 fiscal year |
| Figure 6: Full Time Employee Equivalents | Shows the percentages of the number ranges for full-time staff currently employed with the nonprofit respondents |
| Figure 7: Part Time Employee Equivalents | Shows the percentages of the number ranges for volunteers currently serving the nonprofit respondents |
| Figure 8: Volunteers | Shows the percentages of the number ranges for volunteers currently serving the nonprofit respondents |